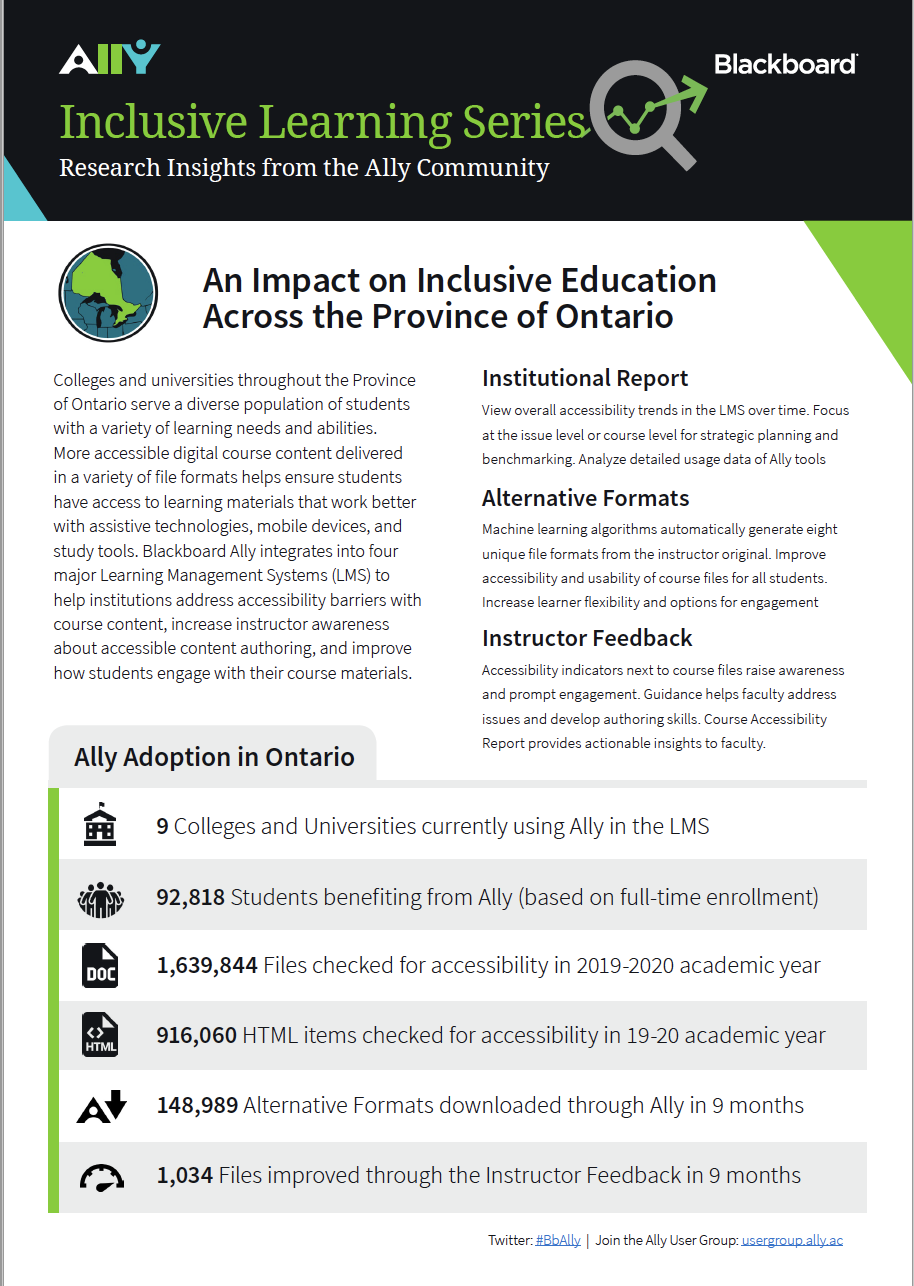
Inclusive Learning Research Series
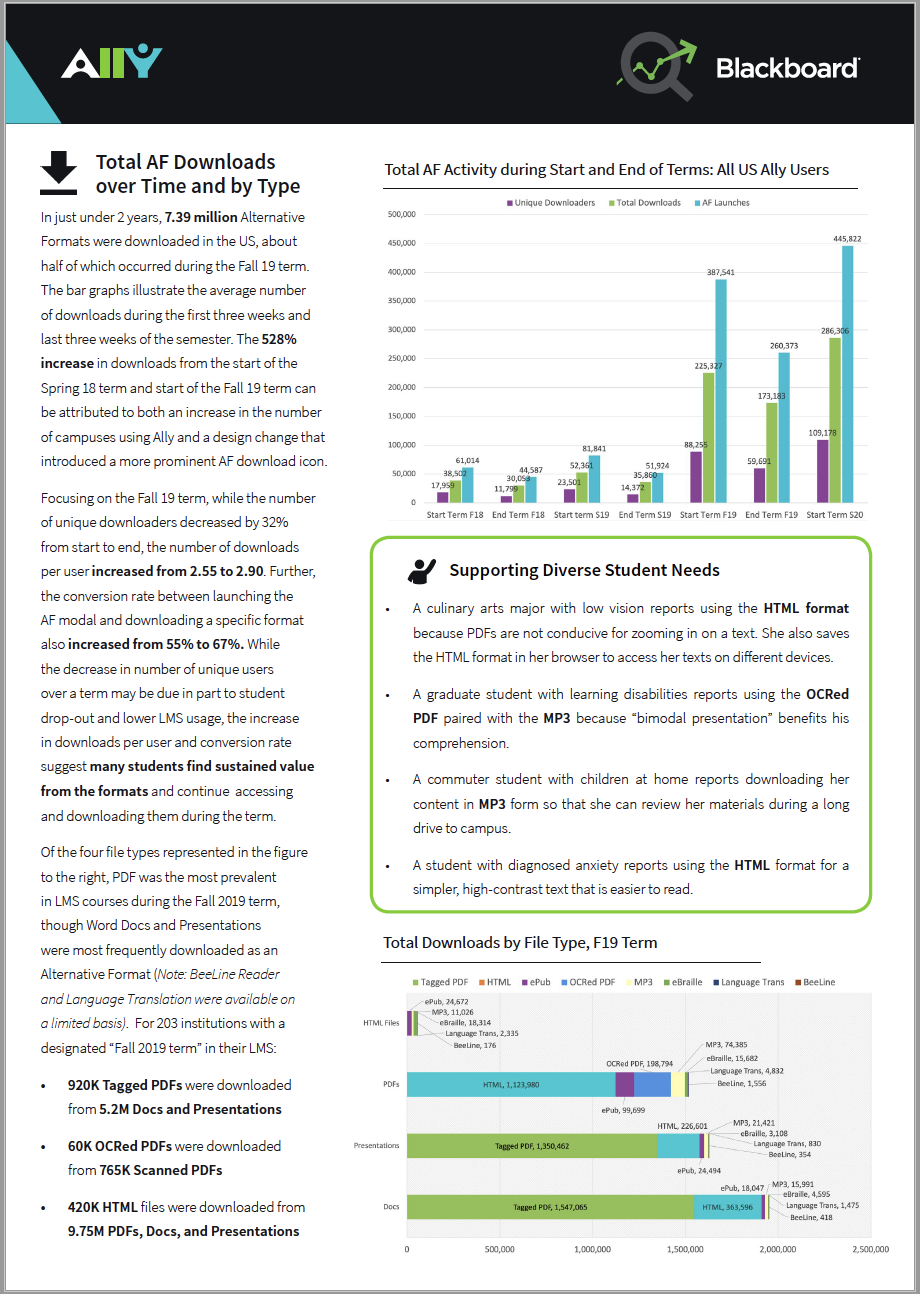
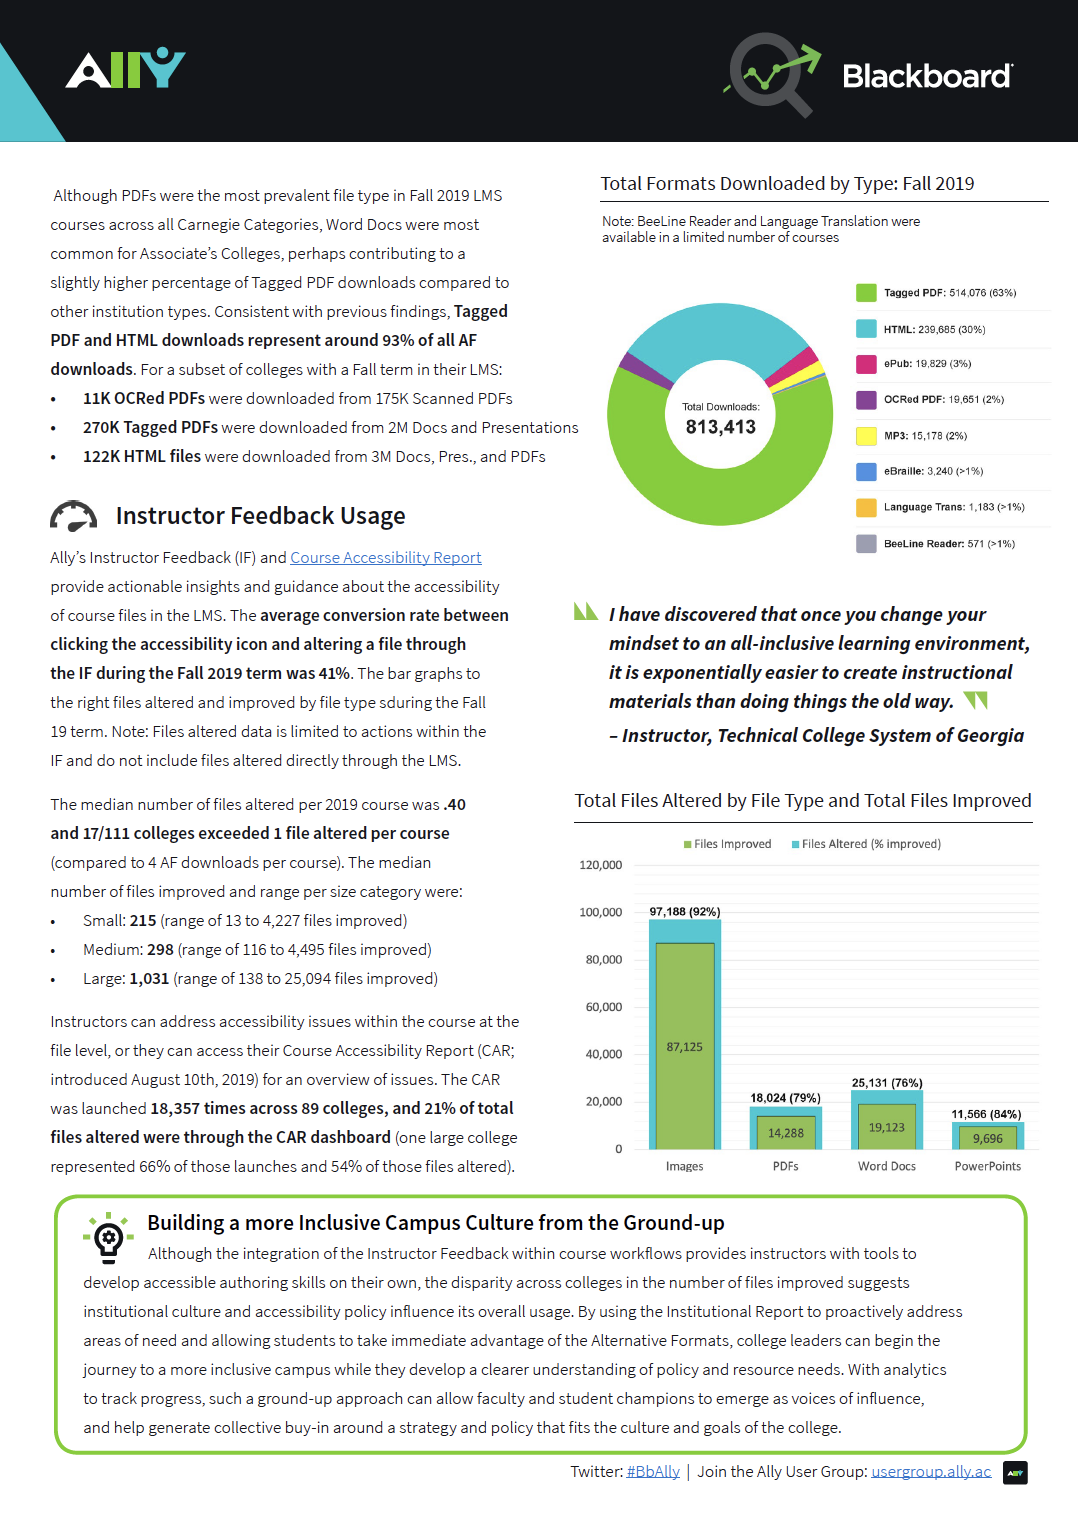
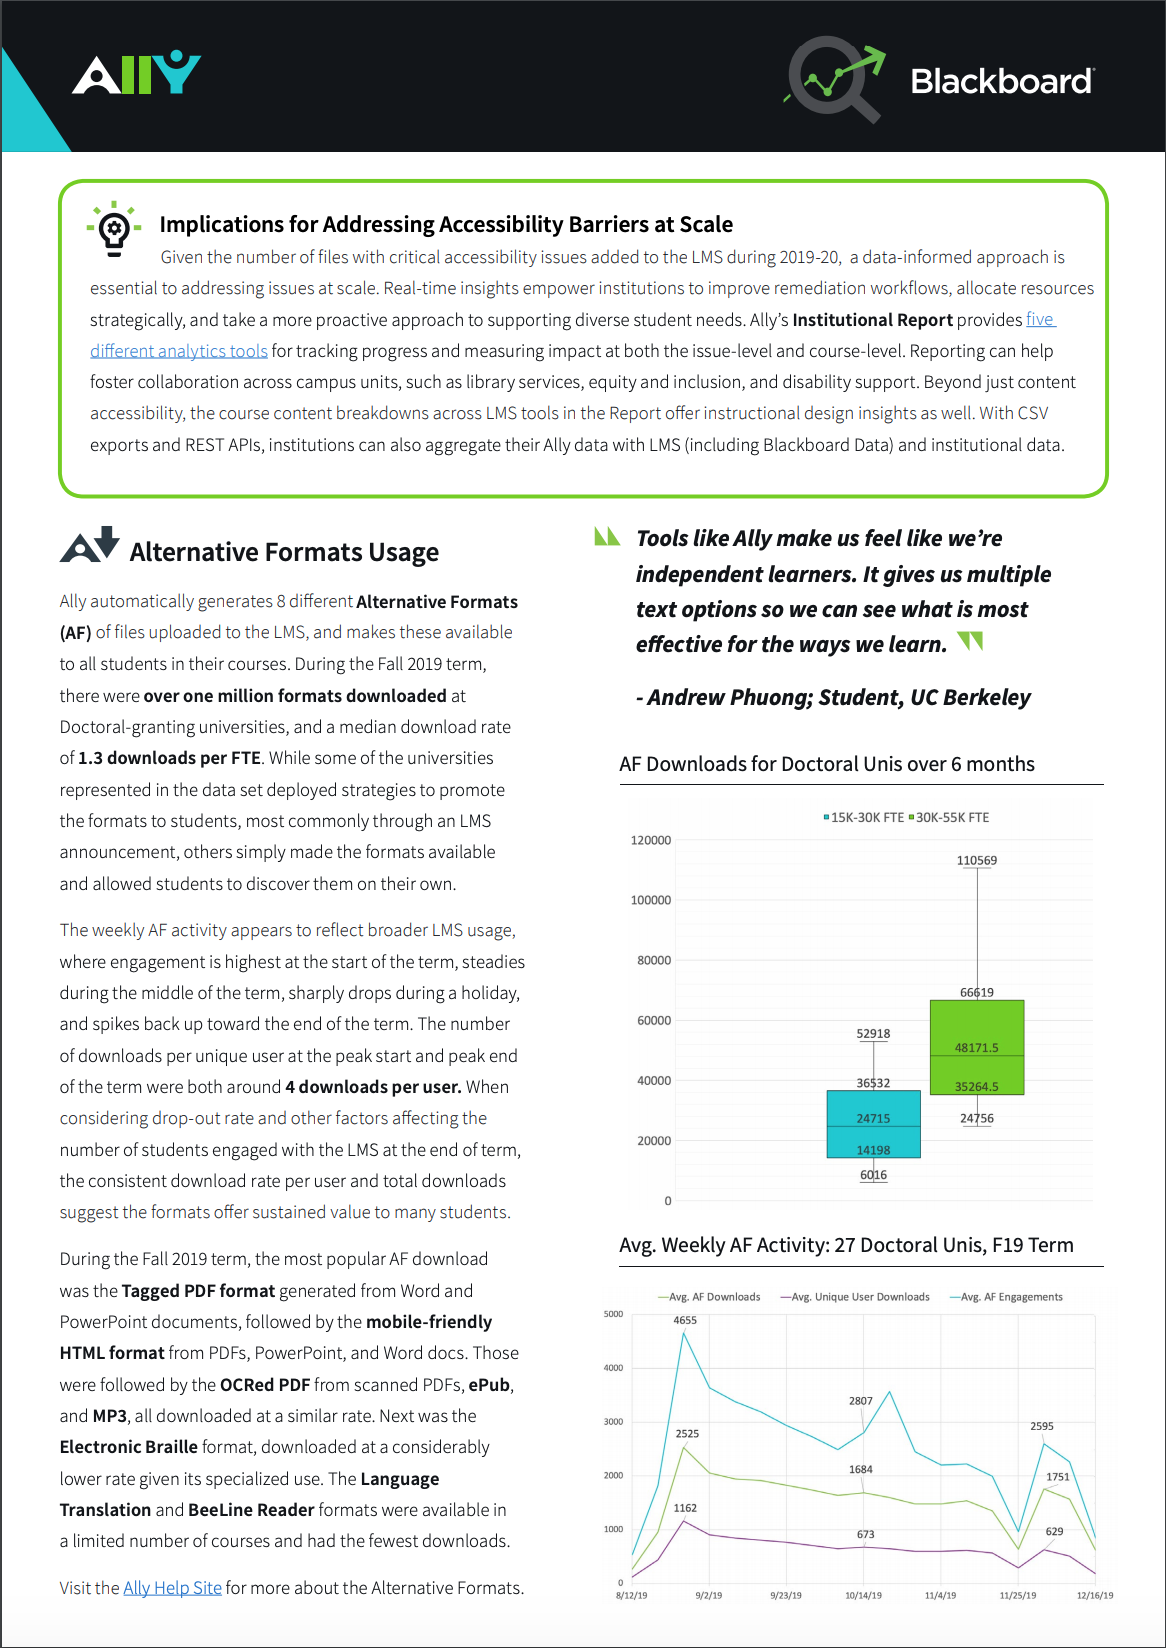
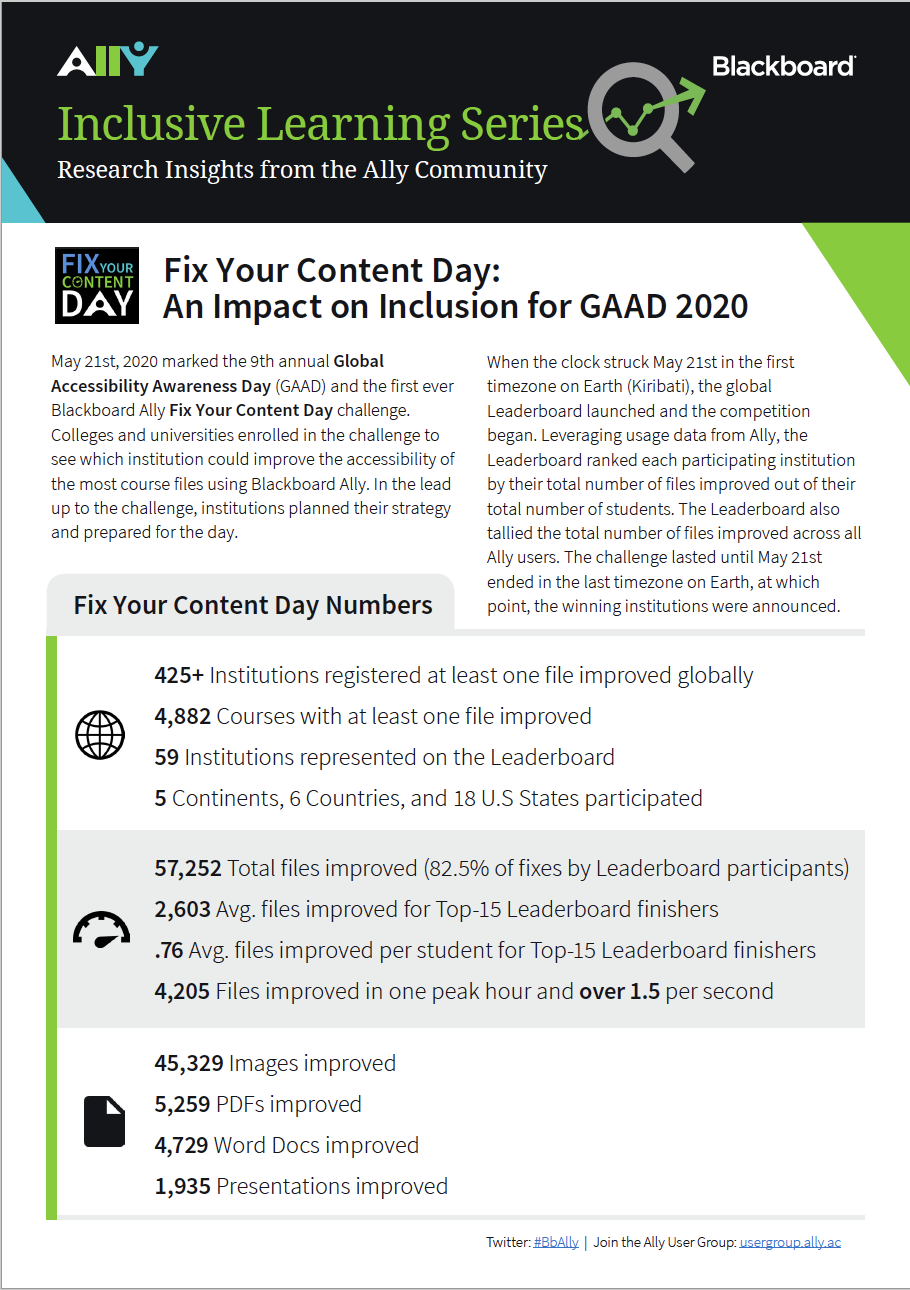
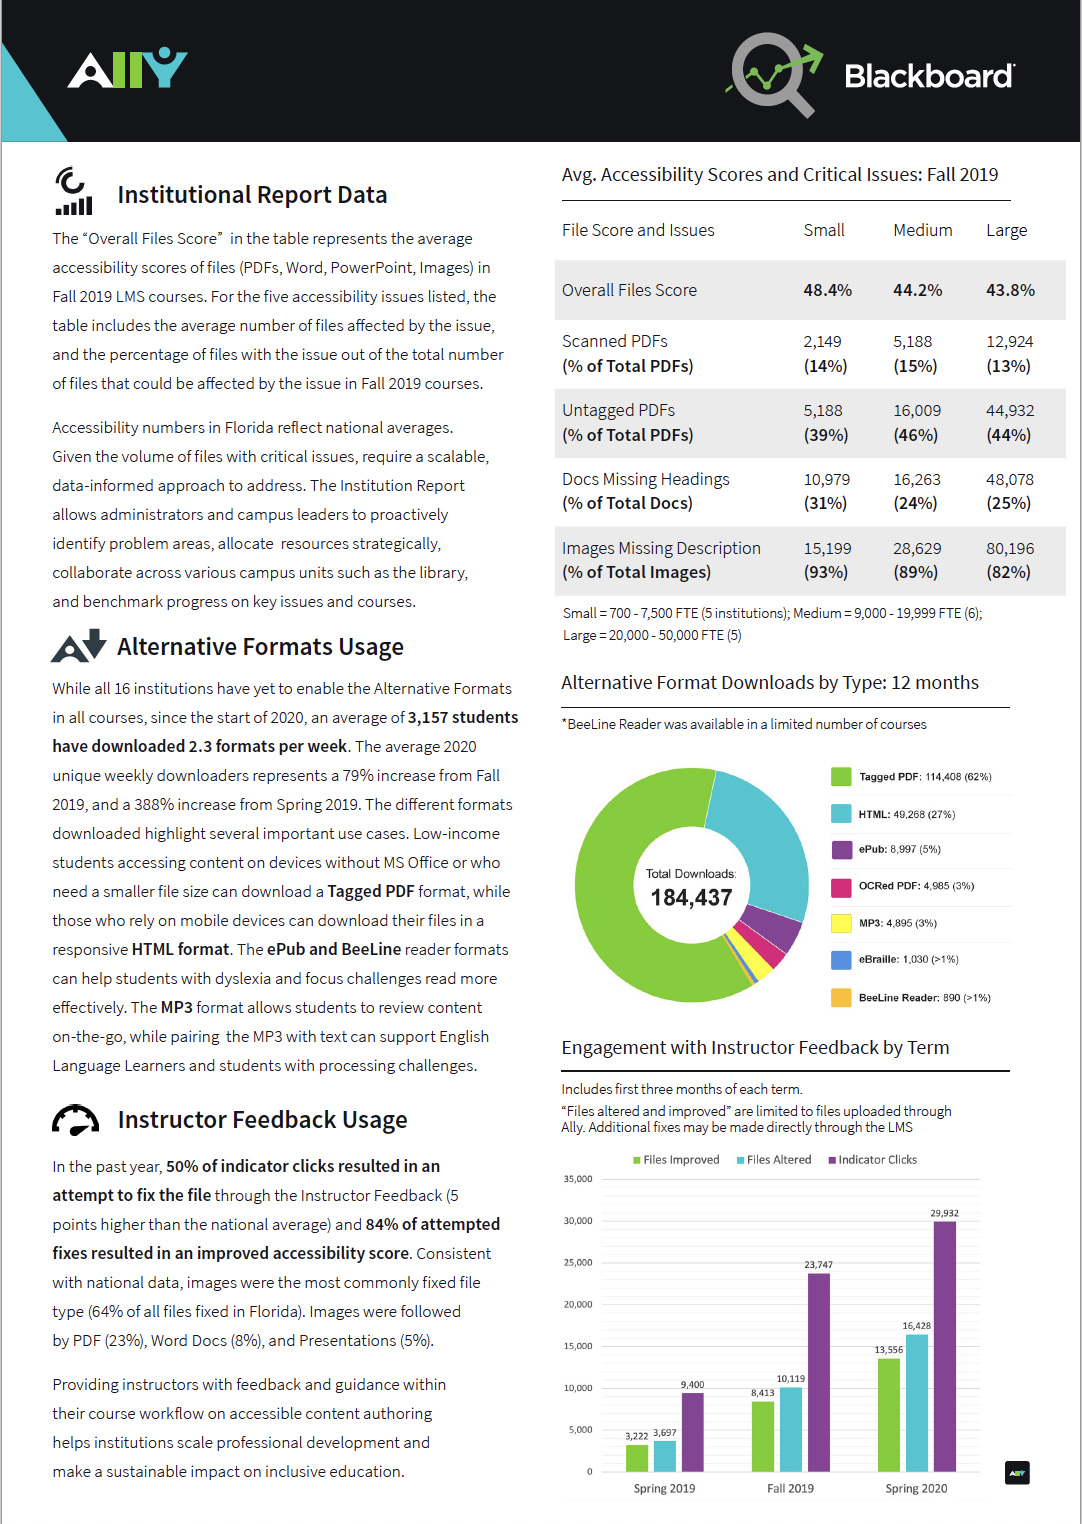
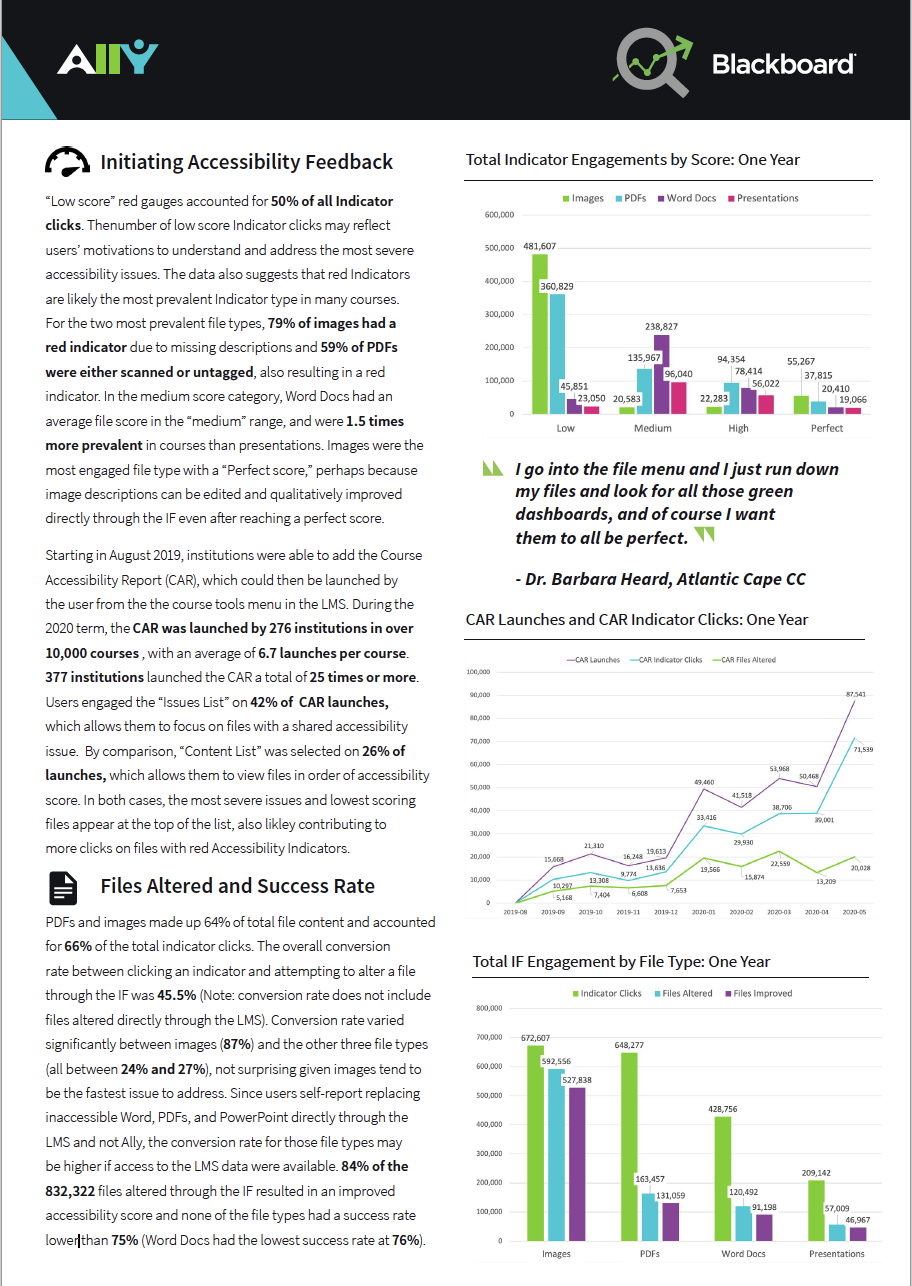
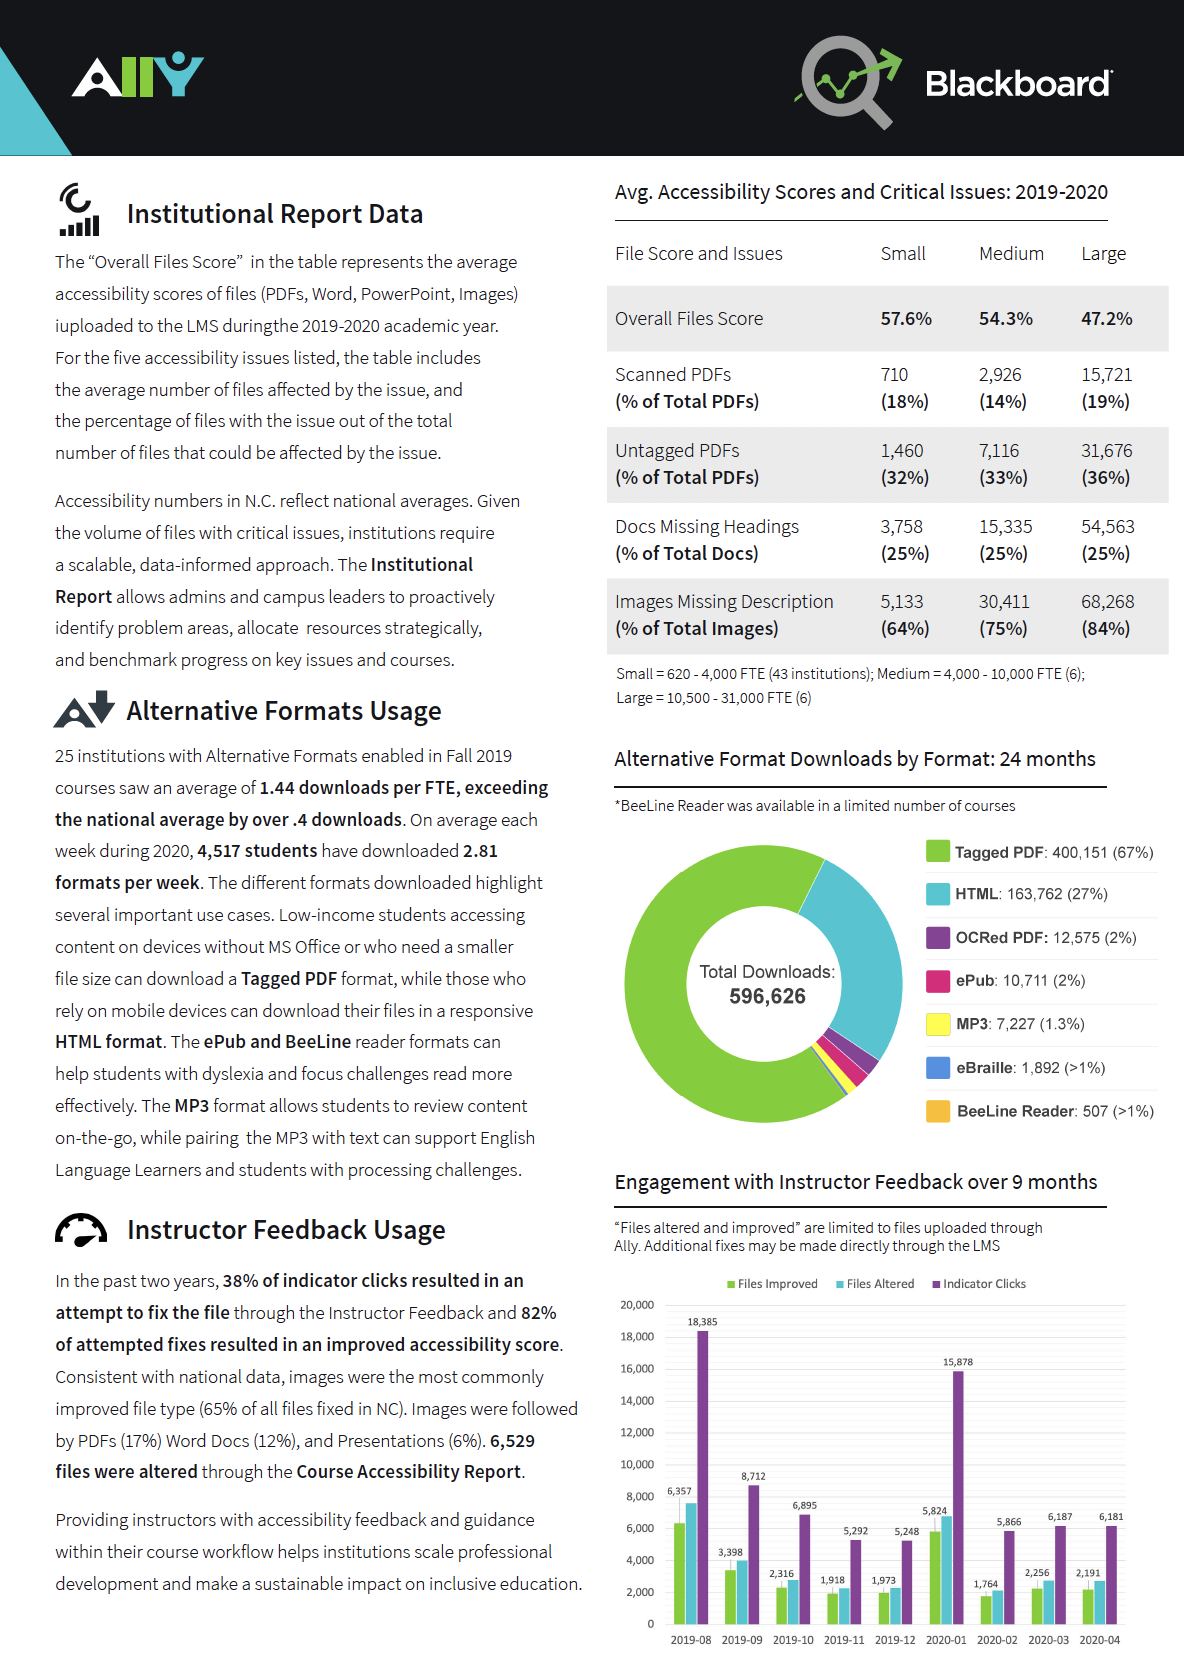
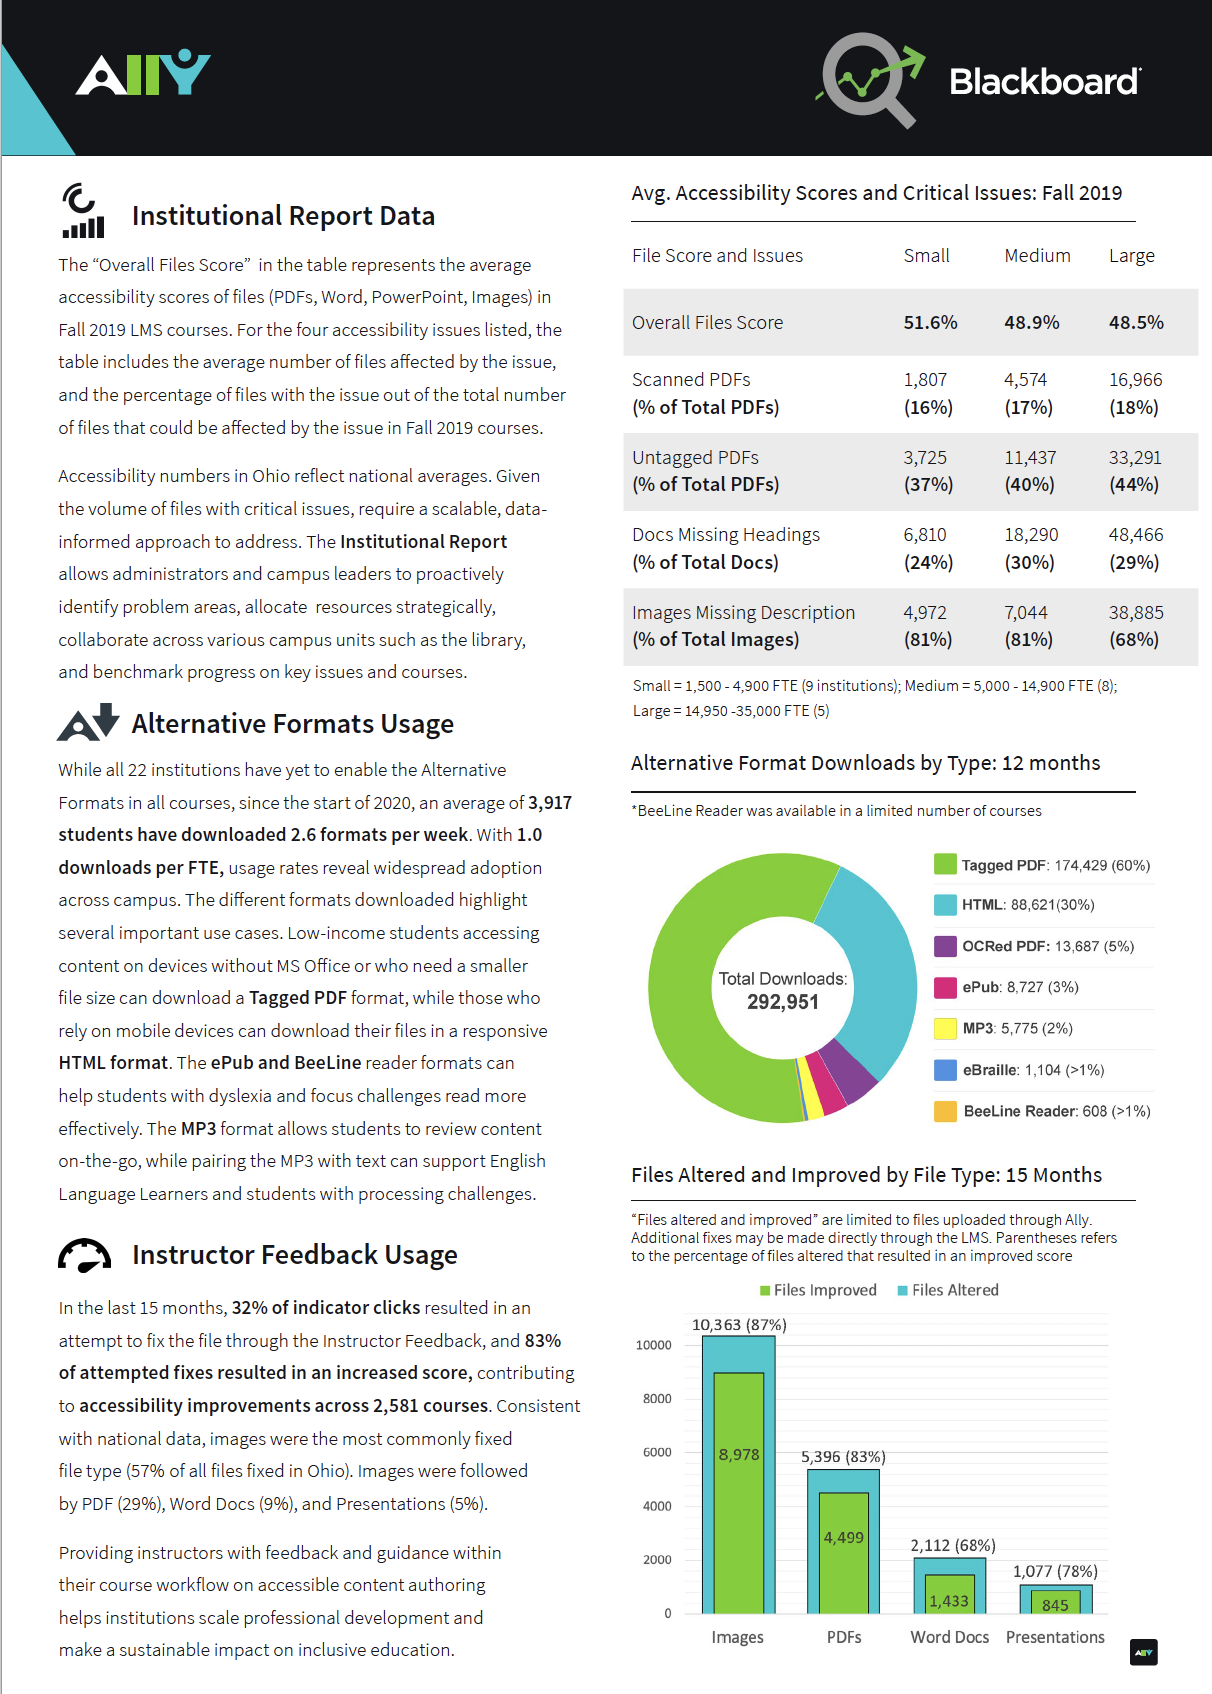
After a year gathering qualitative data through on-campus interviews and documenting findings in a blog series during the 2019 Ally Tour, the Ally Community has spent 2020 exploring quantitative usage and accessibility data mined through the Ally software. To shed light on Ally’s impact around the world, trends in digital content accessibility, and how people are using Ally on their campuses, we launched the 2020 Inclusive Learning Research Series. On this page, you can find recent data visualizations and whitepapers from the series.
Accessibility Scores and Issues
The “Accessibility Scores and Issues” chart includes accessibility data for the 2019-2020 academic year from the Institutional Reports of 568 U.S. Higher Education institutions organized by state. From the drop-down menu,select the variable by which you want to view the chart.
Adoption and Usage
The “Adoption and Usage” chart includes Ally adoption and usage data for 697 U.S. Higher Education institutions organized by state and color coded by region. From the drop-down menu, select the variable by which you want to view the chart.
Research Papers
Throughout 2020, we’ve been publishing the Inclusive Learning Research Series whitepapers on the Ally User Group. These exploratory papers follow an academic research format, which includes study context, research questions, analysis, and implications sections.
